What Is a Healthy Body Fat Percentage?
For most adults, a healthy body fat percentage falls roughly between 8 and 24 percent for men and 21 and 35 percent for women. The exact healthy number depends on your age and your sex, and it rises gradually as you get older. That range may look wide, but it reflects real differences in how bodies store fat across a lifetime.
Body fat percentage is the share of your body weight that is fat. Everything else is lean mass: muscle, bones, organs, and water. Two people can weigh exactly the same and look completely different, because one carries more muscle and the other carries more fat. That is why body fat percentage tells you far more about your health than the number on the bathroom scale alone.
In this guide, you will find healthy ranges by age and sex, the standard body fat categories, why women need more body fat than men, the dangers of going too low, why belly fat matters more than the total number, and how to measure your own body fat percentage at home. If you already know your number, you can also jump straight to the Body Fat Percentage Calculator to track it over time.
- Healthy bands: men about 8 to 24 percent, women about 21 to 35 percent, rising with age.
- Age rule: use the band for your age, not the band your 25-year-old self lived in.
- Visceral warning: a waist above 102 cm (40 inches) for men or 88 cm (35 inches) for women raises risk even when total body fat looks fine.
- One-method rule: track with one method under the same conditions, and never compare numbers across devices.
The Short Answer: It Depends on Age and Sex
There is no single healthy body fat percentage that fits everyone. Age and sex change the picture in important ways. Women naturally carry more body fat than men, because their bodies need extra fat for hormones and reproduction. Older adults carry more fat than younger adults, because muscle mass tends to fall with age while fat slowly accumulates.
- Men: about 8 to 24 percent is considered healthy, depending on age.
- Women: about 21 to 35 percent is considered healthy, depending on age.
- Athletes: trained athletes often sit below these ranges, which is normal for their sport but not necessary for everyday health.
- Above the healthy range: generally 25 percent or more for men and 32 percent or more for women is classed as obese on the ACE scale.
Think of these numbers as a healthy band rather than a single target. Someone at 15 percent and someone at 22 percent can both be healthy, as long as the rest of their health picture looks good. What matters most is staying inside the healthy band for your age and sex, and paying attention to where your fat sits, which we will cover below.
What Is the Average Body Fat Percentage?
The average American adult carries more fat than the healthy bands allow. National Health and Nutrition Examination Survey (NHANES) DXA data put the average adult man near 28 percent body fat and the average adult woman near 40 percent (NHANES analysis: https://pmc.ncbi.nlm.nih.gov/articles/PMC3837418/).
That average is a comparison point, not a target. It sits above the healthy bands for both sexes, which is itself a useful reality check: being “about average” does not mean being in a healthy range. Compare yourself with the band for your age and sex, and use the average only to understand where the population sits.
In the United States, NHANES DXA data put the average adult man near 28 percent body fat and the average adult woman near 40 percent.
Both averages sit above the healthy bands, so being “about average” does not mean being in a healthy range. Use the band for your age and sex as your target, and the average only as a population comparison.
Healthy Body Fat Percentage Chart by Age and Sex
Healthy ranges rise with age: men go from 8 to 19 percent at 20 to 39 up to 13 to 24 percent at 60 to 79, and women go from 21 to 32 percent up to 24 to 35 percent. The most widely cited healthy ranges come from research by Gallagher and colleagues, published in the American Journal of Clinical Nutrition in 2000. The study covered 1,626 adults and mapped body fat percentages to the BMI cutoffs used by the NIH and WHO. The result is a set of age-based ranges that doctors and fitness professionals still use today.
| Age group | Men | Women |
|---|---|---|
| 20 to 39 | 8 to 19% | 21 to 32% |
| 40 to 59 | 11 to 21% | 23 to 33% |
| 60 to 79 | 13 to 24% | 24 to 35% |
Notice that the healthy ranges rise with age. This is not a mistake, and it does not mean that gaining fat is good for you. As people age, muscle mass tends to fall and fat tends to accumulate, even when body weight stays the same. The ranges above reflect what is typical and healthy for each age group, given that natural shift.
Use the chart as a guide, not a diagnosis. A single measurement is a snapshot, and every measurement method has some error. If your number sits near the edge of a range, or if you have a health condition, talk with your doctor about what target makes sense for you. The trend over months matters more than any single reading.
Healthy Ranges by Decade (Supplementary Table)
The Gallagher table above uses 20-year bands. This supplementary table breaks the same idea into decades, because many readers search for their exact decade. It is based on ACE and ACSM-style guidance for non-athlete adults, and it does not replace the Gallagher table above (decade guide: https://www.corahealth.app/blog/body-fat-percentage-by-age).
| Age | Men, healthy range | Women, healthy range |
|---|---|---|
| 20 to 29 | 8 to 19% | 21 to 32% |
| 30 to 39 | 11 to 21% | 23 to 33% |
| 40 to 49 | 14 to 23% | 24 to 34% |
| 50 to 59 | 16 to 24% | 25 to 35% |
| 60 to 69 | 17 to 25% | 26 to 36% |
| 70 and above | 18 to 26% | 27 to 37% |
Decade tables vary slightly by source, which is exactly why the chart reconciliation section above exists. If this table and the Gallagher table give you slightly different answers, use your decade as the finer guide and your trend over time as the deciding factor.
Three Examples: How Age Changes the Verdict
Readers do not see themselves in a table. They see themselves in an example. These three use the Gallagher bands already in this article.
A 30-year-old man at 20 percent is above his Gallagher 20 to 39 band (8 to 19 percent) but inside the 40 to 59 band (11 to 21 percent). Age context changes the verdict, but his waist trend still decides the risk. If his waist is climbing, the number needs action even though an older man could carry it comfortably.
A 45-year-old woman at 31 percent is inside her Gallagher 40 to 59 band (23 to 33 percent). The number alone looks fine, so her waist trend is the deciding check. A stable waist with rising strength is a good picture. A rising waist at the same percentage is not.
A 65-year-old man at 22 percent is inside his Gallagher 60 to 79 band (13 to 24 percent). Chasing the 15 percent he carried at 25 would be inadvisable now. Protecting muscle and strength matters more at this age than reaching a younger number, as the older-adult section below explains.
Why Body Fat Charts Disagree (and Which One to Trust)
There is no official medical cutoff for body fat percentage the way there is for blood pressure. That is why charts disagree, and it is not a mistake in any one chart. The three main frames answer different questions.
| Frame | Men | Women | What it is for |
|---|---|---|---|
| ACE (fitness frame) | Essential 2 to 5%, athletes 6 to 13%, fitness 14 to 17%, acceptable 18 to 24%, obese 25% and above | Essential 10 to 13%, athletes 14 to 20%, fitness 21 to 24%, acceptable 25 to 31%, obese 32% and above | Plain-language fitness categories |
| ACSM (clinical frame) | About 10 to 22% | About 20 to 32% | Risk-reduction range cited in American College of Sports Medicine guidance |
| Gallagher (health-and-mortality frame) | 8 to 19% at 20 to 39, rising to 13 to 24% at 60 to 79 | 21 to 32% at 20 to 39, rising to 24 to 35% at 60 to 79 | Age-specific healthy ranges tied to BMI cutoffs (American Journal of Clinical Nutrition, 2000, 1,626 adults) |
The same person can land in different categories depending on which chart you use. A 30-year-old man at 20 percent is above his Gallagher young-adult band but inside the ACSM clinical range. That is expected, not an error.
Use Gallagher for the band that fits your age, ACE when you want plain language for where you stand, and ACSM as a clinical cross-check. When charts disagree, trust your trend over months and your waist measurement, and ask your doctor if your number sits near a boundary or you have a health condition.
Which Body Fat Chart Should I Trust When Charts Disagree?
All three main frames are honest, they just answer different questions. Use the Gallagher age-banded ranges for the band that fits your age, the ACE categories when you want plain language for where you stand, and the ACSM clinical range (about 10 to 22 percent for men, 20 to 32 percent for women) as a cross-check.
There is no single official cutoff. When charts disagree, trust your trend over months and your waist measurement, and ask your doctor if your number sits near a boundary.
One Chart Does Not Fit Every Ethnicity
The charts in this article come mostly from European and North American populations, and they can mislead other groups. Asian adults tend to carry more visceral fat at the same BMI than European adults, so cardiometabolic risk starts at a lower BMI.
A World Health Organization expert consultation in 2004 set public-health action points for Asian populations at BMI 23 for increased risk and BMI 27.5 for high risk, against the international 25 and 30 (WHO consultation summary: https://bmicalculator.it.com/blog/bmi-south-asian-pakistan.html). In practical terms, a South Asian adult at BMI 23 carries roughly the risk profile of a European adult at BMI 27 to 28.
If you are of South or East Asian descent, do not rely on BMI or a single body fat chart alone. Use your waist measurement and waist-to-height ratio alongside them, and discuss your numbers with your doctor rather than assuming a “normal” BMI means no concern.
Body Fat Categories: Essential, Athlete, Fitness, Acceptable, Obese
The American Council on Exercise groups body fat into five categories, from essential fat your body needs to survive up to the obese range where health risks rise clearly. The American Council on Exercise (ACE) groups body fat percentage into five categories. These categories give you plain language for where you stand, from the bare minimum your body needs up to the level where health risks rise clearly.
| Category | Men | Women |
|---|---|---|
| Essential fat | 2 to 5% | 10 to 13% |
| Athletes | 6 to 13% | 14 to 20% |
| Fitness | 14 to 17% | 21 to 24% |
| Acceptable | 18 to 24% | 25 to 31% |
| Obese | 25% and above | 32% and above |
Essential Fat
Essential fat is the floor. Your body needs this fat to protect your organs, regulate your temperature, and make hormones. Men need about 2 to 5 percent, and women need about 10 to 13 percent. Staying near this floor is not a goal. It is the minimum for the body to keep working properly, and dropping below it is dangerous.
Athletes
Athletes typically carry 6 to 13 percent body fat for men and 14 to 20 percent for women. These are lean bodies built for performance, and they are maintained with careful training, nutrition, and coaching. For most people, athlete-level leanness is not necessary for good health, and chasing it can cause more harm than good.
Body Fat Ranges by Sport (Short Guide)
Athletes do not share one body fat range. The right number depends on what the sport rewards. These are typical ranges for trained athletes, and an athlete can perform at world-class level outside them (sport ranges: https://www.bodyspec.com/blog/post/athlete_body_fat_percentage_charts_and_guidelines).
| Sport group | Men | Women |
|---|---|---|
| Distance running | 5 to 10% | 10 to 16% |
| Cycling | 5 to 12% | 12 to 18% |
| Soccer | 6 to 14% | 13 to 19% |
| Basketball | 6 to 12% | 18 to 25% |
| Swimming | 8 to 12% | 18 to 24% |
| Gymnastics | 5 to 10% | 10 to 17% |
| Powerlifting and throwers | 15 to 25% and above | 22 to 30% and above |
| Bodybuilding, competition day | 3 to 5% | 8 to 12% |
Two notes. Swimmers often carry more fat than runners despite training just as hard, because fat helps buoyancy in the water. And competition bodybuilding levels are short-term peaks reached for a show, not year-round targets. Holding them long term carries the hormonal and bone risks described in the too-low section.
Fitness
The fitness band covers 14 to 17 percent for men and 21 to 24 percent for women. People in this range are typically active, train regularly, and eat reasonably well. You will often see some muscle definition here, and this is a realistic and healthy target for many adults who exercise consistently.
Acceptable
The acceptable band covers 18 to 24 percent for men and 25 to 31 percent for women. This is where many healthy adults land. You may not have visible abs, and that is fine. Being in the acceptable band still means your body fat level is within a range that is consistent with good health for most people.
Obese
On the ACE scale, 25 percent and above for men and 32 percent and above for women is classed as obese. That label is a health classification, not a judgment about a person. Above these levels, the risk of type 2 diabetes, high blood pressure, heart disease, and joint problems rises. If you are in this range, even a modest, steady reduction in body fat can meaningfully improve your health.
What Body Fat Percentage Is Obese?
Generally 25%+ for men and 32%+ for women on the ACE classification.
The Three Types of Body Fat, Named Together
Body fat comes in three named parts, and naming all three completes the picture. Essential fat is the floor your body needs to work: 2 to 5 percent for men, 10 to 13 percent for women. It protects organs, regulates temperature, and supports hormone production.
Everything above essential fat is storage fat, the body’s energy reserve. Storage fat splits into two kinds. Subcutaneous fat sits under the skin. You can pinch it, and while too much of it is still a health concern, it is the less harmful kind. Visceral fat sits deeper, around your organs, and it is the dangerous kind. The visceral section below explains why that split matters more than the total number.
What Does Each Body Fat Percentage Look Like?
Numbers alone do not tell you what a percentage looks like in the mirror. Two people at the same percentage can look quite different, because muscle size, fat distribution, and genetics all change the picture. Use this table as a rough guide, not a diagnosis.
| Range | Men: what you will likely see | Women: what you will likely see |
|---|---|---|
| 25% and above (men) / 30% and above (women) | Soft midsection, no ab definition | Soft midsection, no ab definition |
| 20 to 24% (men) / 25 to 29% (women) | Little to no ab definition | Faint upper-ab outline possible in some |
| 15 to 19% (men) / 20 to 24% (women) | Upper-ab outline for some, clearer near 15% | Early outline for some, clearer within this band |
| 10 to 14% (men) / 16 to 19% (women) | Clear definition for most by about 10 to 12% | Defined abs for many, athletic look |
| Below 10% (men) / below 16% (women) | Stage-lean, hard to sustain | Distinct abs, hormonal risks rise |
For abs specifically, published guides put the thresholds here: in men, outlines typically appear at 10 to 12 percent, and a distinct six-pack at 6 to 9 percent. In women, outlines typically appear at 20 to 22 percent, an athletic look at 16 to 19 percent, and distinct definition below 16 percent (GymBeam: https://gymbeam.com/blog/what-percentage-of-body-fat-do-you-need-to-have-to-see-abs/).
Treat these as ranges, not cutoffs. Bigger ab muscles show through more fat, and people who store fat mainly on hips and thighs may see upper abs earlier than people who store it on the belly. Photos also mislead: lighting, flexing, and a post-workout pump can make someone look several points leaner than they are.
What Body Fat Percentage Do I Need for Visible Abs?
In men, ab outlines typically appear at 10 to 12 percent body fat, and a distinct six-pack at 6 to 9 percent.
In women, outlines typically appear at 20 to 22 percent, an athletic look at 16 to 19 percent, and distinct definition below 16 percent. These are ranges, not cutoffs: bigger ab muscles show through more fat, and fat distribution and genetics shift the threshold in either direction.
Is 15% Body Fat Good? Is 25% Bad? Is 30% Obese?
Is 15% body fat good?
For a man, yes for most active men. Fifteen percent sits inside the fitness band (14 to 17 percent), and it is a realistic, sustainable target for many who train regularly.
For a woman, 15 percent is below the healthy band for most women and inside athlete territory (14 to 20 percent). It is realistic only for trained athletes, and it is not advisable as a year-round target for most women, because the hormonal risks described in the too-low section rise sharply at this level.
Is 25% body fat bad?
For a man, 25 percent is the line itself: the ACE scale classes 25 percent and above as obese. It is a clear signal to act, but it is also a very fixable one. A modest, steady reduction improves health markers well before you reach the fitness band.
For a woman, 25 percent is inside the acceptable band (25 to 31 percent) and healthy for many women. The deciding checks are your waist measurement and your trend. A 25 percent reading with a rising waist is a different story from 25 percent with a stable waist.
Is 30% body fat obese?
For a man, yes on the ACE scale: 30 percent is above the 25 percent obesity line, and it sits in clear health-risk territory. The action plan below is written for exactly this situation.
For a woman, 30 percent is near the top of the acceptable band (25 to 31 percent) and not yet classed as obese on the ACE scale, which sets that line at 32 percent. But “not obese” is not the same as “no concern.” If your waist is above the cutoff in the waist section below, your risk is higher than the percentage alone suggests.
Fifteen percent is realistic for many active men, since it sits inside the fitness band, but for most women it is athlete territory and not advisable as a year-round target.
Twenty-five percent is the ACE obesity line for men, so it is a signal to act, but for women it sits inside the acceptable band and is healthy for many. The same number means different things for men and women, which is why you should always judge it against your own sex and age band.
Why Women Need More Body Fat Than Men
Women need more body fat than men, and that is by design. The essential fat floor for women is 10 to 13 percent, compared with 2 to 5 percent for men. That extra fat supports hormones, including estrogen, and it supports reproduction. A woman’s body keeps a reserve of fat so that it can handle the energy demands of pregnancy and breastfeeding if they come.
Women also store fat differently. More of it tends to sit around the hips, thighs, and breasts, which is normal and healthy. Men tend to store more fat around the belly. These patterns are shaped by hormones, and they are one reason why comparing your number directly with someone of the opposite sex does not make sense. A healthy percentage for a man can be dangerously low for a woman.
This is also why a woman at 24 percent body fat and a man at 24 percent body fat are in very different places. She is in the fitness band. He is at the top of the acceptable band. Use the chart for your own sex, and judge your number against the range that fits your body.
Menopause Changes Where Fat Goes
Falling estrogen in perimenopause and menopause shifts fat storage from the hips and thighs toward visceral belly fat. This happens even when total weight barely changes, which is why many women notice their shape changing before the number on the scale does.
A meta-analysis of over 1 million women found that during the menopause transition, waist circumference rose by 4.6 cm and trunk fat rose by 5.5 percent, while leg fat fell by 3.2 percent (HealthyWomen summary: https://www.healthywomen.org/your-health/menopause-belly?context=&context_title=&page=2). The legs look thinner as the midsection grows, and the total body fat percentage can look normal while the risk profile has genuinely worsened.
That makes waist tracking more important than scale tracking at this stage of life. Resistance training, enough protein, good sleep, and stress management all help against visceral gain. If you are going through menopause and your waist is climbing, discuss it with your doctor, including whether any medical options make sense for you. This article does not recommend any treatment, it only flags the pattern to watch.
Falling estrogen in perimenopause and menopause shifts fat storage from the hips and thighs toward visceral belly fat, even when total weight barely changes. A meta-analysis of over 1 million women found waist circumference rose by 4.6 cm and trunk fat by 5.5 percent during the transition, while leg fat fell by 3.2 percent.
That makes waist tracking more important than scale tracking at this stage, and resistance training, protein, sleep, and stress management all help against visceral gain.
Can Body Fat Be Too Low?
Yes. Body fat can absolutely be too low, and this is a risk that does not get enough attention. Social media rewards extreme leanness, and photos of shredded physiques make very low body fat look normal. In real life, staying near essential fat levels for long periods puts real strain on the body, and the health costs can be serious.
- Hormones drop. In men, testosterone can fall. In women, menstrual cycles can stop when body fat stays below roughly 17 percent for extended periods.
- Immunity weakens. With too little fat, the immune system does not work as well, and infections become more likely.
- Muscle breaks down. When fat reserves run too low, the body may break down muscle for fuel.
- Bones stop being repaired. Low energy availability and low hormones slow bone repair, raising the risk of stress fractures and long term bone loss.
- Leptin falls. Leptin is the hormone that tells the brain your energy reserves are enough. When it drops too far, hunger, mood, and hormones all suffer.
- Everyday life gets harder. Cold sensitivity, low energy, poor sleep, hair shedding, and constant hunger are common when body fat is too low.
If you are dieting hard and you notice missed periods, a falling libido, constant fatigue, or repeated illness, those are warning signs, not badges of discipline. A healthy body fat target leaves you enough reserve to live, train, recover, and feel well. Leanness that costs you your health is not worth it.
Older Adults: Do Not Chase Your Younger Numbers
Body fat percentage rises with age, then eventually falls again. A 2025 study of 29,064 Chinese adults found that body fat percentage peaks at age 65 in men and age 73 in women, after which it naturally declines (Frontiers in Public Health: https://pmc.ncbi.nlm.nih.gov/articles/PMC12226293/).
Muscle falls at the same time, about 3 to 8 percent per decade after age 30, and faster after 60 (muscle loss guidance: https://www.ncoa.org/article/how-to-build-and-maintain-muscle-mass-after-50/). That combination is why very low body fat in older adults links to frailty risk rather than better health. A falling percentage after 70 can mean muscle loss, not fat loss.
The goal at 60 and above is different: protect muscle and strength, keep your waist in check, and set targets with your doctor. Aggressively pursuing a young-adult range at this age can be medically inadvisable, and it is a goal worth abandoning in favor of strength, balance, and independence.
The Clinical Name for Too-Low Symptoms
The symptoms listed above, missed periods, falling testosterone, bone loss, constant fatigue, and repeated illness, have a clinical name when they are driven by eating too little relative to training: relative energy deficiency in sport, usually shortened to RED-S.
The International Olympic Committee introduced the RED-S framework in 2014, expanding the older Female Athlete Triad, and updated it again in 2023. It affects men as well as women, and it covers hormonal, bone, immune, and performance effects, not just weight (RED-S review: https://www.frontiersin.org/journals/sports-and-active-living/articles/10.3389/fspor.2026.1932921/full). If you train hard and eat too little, talk to a doctor or a sports dietitian rather than pushing through the symptoms.
Why Visceral Fat Matters More Than the Number
Visceral fat matters more than the total number because it surrounds your organs and raises disease risk even when your total body fat looks acceptable. Not all body fat is equal. Subcutaneous fat sits under the skin. You can pinch it, and while too much of it is still a health concern, it is the less harmful kind. Visceral fat sits deeper, around your organs. It is the dangerous kind, and it raises the risk of high blood pressure and type 2 diabetes, even in people who do not look very overweight.
Visceral fat usually shows up as belly fat. A growing waistline, especially when your weight has not changed much, can be a sign that visceral fat is building up. Your waist size is a quick, free check you can do at home with a tape measure. Measure around your waist at the level of your belly button, after breathing out normally, and track the number over time.
The Harvard Nutrition Source explains why waist size and body fat distribution matter alongside total weight. Two people with the same body fat percentage can face different risks if one carries most of that fat around the belly and the other carries it around the hips and thighs.
- Track your waist along with your body fat percentage, not instead of it.
- Regular activity, enough sleep, and a diet built around whole foods all help reduce visceral fat.
- Crash diets tend to cost muscle as well as fat. Slow, steady fat loss protects your muscle and keeps the loss coming from fat.
Waist Cutoffs: The Numbers Your Waist Check Needs
The waist section above teaches the measurement but gives no number to check against. Here are the numbers.
The US National Institutes of Health uses waist circumference of 102 cm (40 inches) or more in men and 88 cm (35 inches) or more in women as the threshold for abdominal obesity, the range where risk of high blood pressure, type 2 diabetes, and raised cholesterol climbs (NIH threshold consensus: https://pmc.ncbi.nlm.nih.gov/articles/PMC7027970/).
Waist-to-height ratio adds a second check that works at any height. Divide your waist by your height, using the same units for both. The UK NICE guideline sorts adults with a BMI under 35 into three bands: 0.4 to 0.49 is healthy, 0.5 to 0.59 is increased risk, and 0.6 or more is high risk. The simple version: keep your waist to less than half your height.
For comparing against these cutoffs, measure at the midpoint between your lowest rib and the top of your hip bone, after a normal exhale, with the tape snug but not compressing the skin. The belly-button method in the section above is fine for tracking your own trend, but use the midpoint method when you compare against a clinical cutoff. Use the same spot every time either way.
Waist size alone cannot tell you how much of your belly fat is visceral, so if your waist is above the cutoff, read our visceral fat guide for what belly fat does and how to reduce it.
Use Three Numbers Together, Never One Alone
BMI, body fat percentage, and waist circumference each miss something on their own. Together they catch almost everything.
| Combination | What it usually means |
|---|---|
| Normal BMI, high body fat, high waist | Hidden risk: normal weight obesity. Act on it. |
| High BMI, healthy body fat, normal waist | Likely muscular. Lower concern, but keep tracking. |
| High BMI, high body fat, high waist | Highest concern. Talk to your doctor. |
| Normal BMI, healthy body fat, normal waist | Reassuring on all three checks. Keep the trend going. |
This three-number check is also the approach the 2025 Lancet Commission recommends: BMI only as a screening tool, with excess fat confirmed by waist circumference, waist-to-height ratio, or a body fat measurement. No single number is a diagnosis, and no single number should be ignored either.
What Is More Important, BMI or Body Fat Percentage?
Body fat percentage, because BMI cannot tell fat from muscle.
A muscular person can have an overweight BMI with a healthy body fat percentage, which is why the percentage is the more useful number when the two disagree.
What Is Skinny Fat (Normal Weight Obesity)?
Skinny fat, clinically called normal weight obesity, means a normal BMI (18.5 to 24.9) combined with a high body fat percentage. A 2026 analysis in the Annals of Internal Medicine found that 26.1 percent of adults with a normal BMI met the criteria for clinical obesity once body fat was measured directly.
If your BMI looks fine but your waist is above the cutoff or your body fat percentage is high, the fix is the same plan as anywhere else: protein, resistance training, and a moderate deficit if fat loss is needed, plus a doctor check.
How to Measure Your Body Fat Percentage
No single method is best for everyone: a DEXA scan is the most accurate, while the free Navy tape method is the best starting point for tracking at home. Every measurement method has tradeoffs. The most accurate methods cost money or require a lab visit. The free and easy methods are less precise, but they are still useful, because tracking the trend over time matters more than getting one perfect number. Here are the main methods, ranked from most to least accurate.
- DEXA scan. A DEXA scan is the most accurate common method. It uses a low dose X-ray to map fat, muscle, and bone. It is expensive and requires a clinic or lab, so most people use it only occasionally.
- Hydrostatic weighing. This method weighs you underwater and is very accurate. It is also inconvenient, since it needs a special tank and facility, so it is mostly used in research and sports labs.
- Skinfold calipers. A trained tester pinches folds of skin at several spots and plugs the measurements into a formula. With a skilled tester, results are typically within about plus or minus 3 percent. With an unskilled tester, error grows quickly.
- Smart scales and BIA. Bioelectrical impedance analysis sends a small current through your body to estimate fat. Smart scales are easy and cheap, but they are the least accurate method, and readings swing with hydration, meals, and time of day.
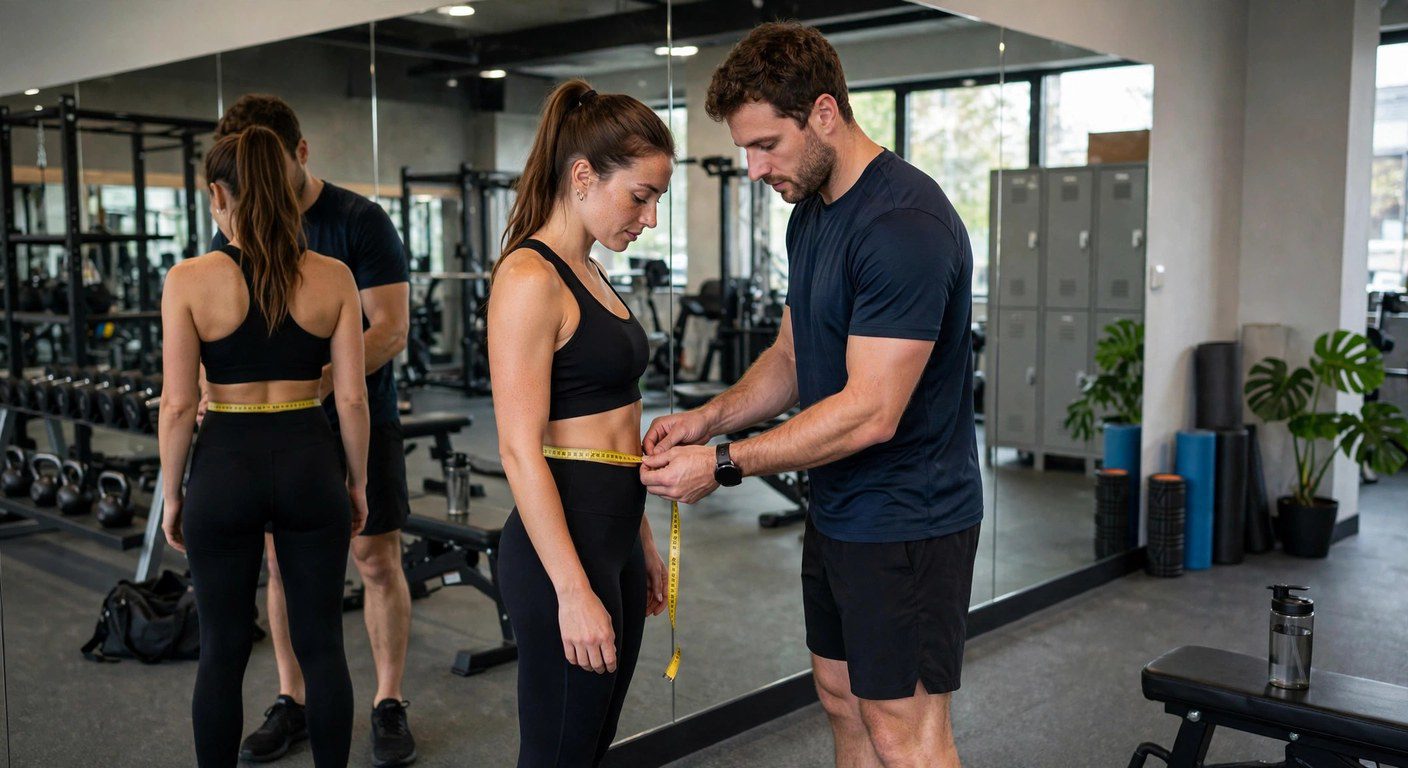
- Navy tape method. This method needs only a tape measure and a formula. You measure your neck, waist, and hips, then calculate your body fat percentage. It is free, it takes two minutes, and it is good enough for tracking your trend.
- Bod Pod (air displacement plethysmography). You sit in a sealed chamber while it measures your body volume from air displacement, then calculates body density and body fat percentage. It is the same idea as underwater weighing without getting wet. Typical error is about 2 to 3 points, cost is about $45 to $75 per test, and it needs a facility visit. Choose it if you want a lab-grade number without radiation and without a water tank.
- 3D body scanning. A booth scans your body shape and estimates body fat from measurements and volume. Typical error is about 4 to 6 points, cost is about $20 to $40 per scan, and the scan itself takes 1 to 2 minutes (3D accuracy comparison: https://www.bodyspec.com/blog/post/bodyspec_dexa_vs_other_body_composition_tests). It is best for fast, frequent tracking and for seeing shape changes, but clothing and lighting affect results, and it gives no bone or visceral fat data.
How to Take Navy Tape Measurements, Step by Step
The measurement section names the Navy tape method but gives no procedure. Here is the procedure, using a flexible, non-stretch tape on bare skin, first thing in the morning before eating.
- Neck: measure just below the larynx (Adam’s apple), with the tape sloping slightly downward at the front. Keep your neck relaxed and do not push it outward.
- Waist: men measure at the navel. Women measure at the narrowest point of the torso. Breathe out normally and do not suck in. Keep the tape level and snug without compressing the skin.
- Hip (women only): measure around the widest point of the hips and buttocks, standing with your feet together.
- Height: standing tall, without shoes.
Take each measurement twice and use the average. The original Hodgdon and Beckett rules round the neck up and the waist and hip down to the nearest half inch, but most calculators handle that for you. For the full worked calculation with the Navy formula, see our guide on how to calculate body fat percentage.
The Body Fat Percentage Calculator does the math for you. For most people, the Navy tape method is the best starting point. It costs nothing, it is easy to repeat, and it gives you a consistent number to track. Measure first thing in the morning, before eating, and use the same tape and the same technique each time. Consistency beats precision for home tracking.
One more point about BMI: body mass index cannot see body composition. Two people with the same BMI can have very different amounts of fat and muscle. A muscular person can have an overweight BMI and a perfectly healthy body fat percentage. That is why body fat percentage is the better number to watch once you are past a basic weight check.
How to Measure Body Fat at Home, and Why Your Scale Disagrees With the Gym
A smart scale gives a rough estimate; the Navy tape method (tape measure + formula) is free and good for tracking.
Use the same method each time and compare trends, rather than chasing any single reading.
The same measurement question comes up when two devices disagree.
A home scale uses bioelectrical impedance, which guesses composition from body water, while a gym machine may use a different impedance equation, a DEXA scan, or an air chamber.
Hydration, meals, time of day, and each device’s own equation can shift readings by several points. Follow the one-method rule: pick one method, use it under the same conditions every time, and never compare numbers across devices.
How Accurate Is Each Body Fat Measurement Method?
Every method has an error margin, and the margin is what decides how much you should trust a single reading. A DEXA scan at 20 percent means your true value is most likely between 18 and 22 percent. A smart scale at 20 percent could mean anywhere from 12 to 28 percent in the worst case. That gap is why trends matter more than single readings.
| Method | Typical error margin | Cost | Convenience | Best for |
|---|---|---|---|---|
| DEXA scan | Plus or minus 1 to 2 points | About $50 to $150 per scan | Low, clinic visit | Accurate baseline, plus regional and visceral fat data |
| Hydrostatic weighing | About 2 to 3 points | About $30 to $75, lab access needed | Low, lab visit | Research-grade snapshot |
| Bod Pod (air displacement) | About 2 to 3 points | About $45 to $75 per test | Low, facility visit | Lab-grade number without getting wet |
| Skinfold calipers (skilled tester) | Plus or minus 3 to 5 points | $0 to $20 for calipers | Medium, needs practice | Cheap, repeatable tracking |
| Navy tape method | About 3 to 4 points | Free | High, two minutes at home | Home tracking |
| 3D body scanning | About 4 to 6 points | About $20 to $40 per scan | Medium, gym or clinic, 1 to 2 minutes on device | Fast, frequent tracking and shape changes |
| BIA smart scale | Plus or minus 3 to 8 points | $25 to $150 one time | High, seconds at home | Convenient trend tracking, not absolutes |
These margins assume proper technique (accuracy comparison: https://acibademinternational.com/blog/how-to-measure-body-fat-from-smart-scales-to-dexa-ranked-by-accuracy/). A rushed skinfold test by an untrained hand can miss by far more, and a dehydrated BIA reading can swing several points in a day. One useful point: a method that is consistently off by the same amount still shows your trend line correctly. Consistency matters as much as accuracy when you are tracking change.
Why Your Scale and the Gym Disagree
If your home scale says 24 percent and the gym machine says 31 percent, neither machine is necessarily broken. They are measuring different things in different ways. A BIA scale guesses your composition from how water conducts a small current. A DEXA scan images your tissue directly. Calipers pinch your skin. A tape method uses circumferences. No two methods should be expected to match.
Hydration alone can move a BIA reading by several points. Meals, time of day, skin temperature, recent exercise, and each device’s own built-in equation all add their own shift. That is why comparing a gym number with a home number is meaningless, even when both devices are working properly.
Follow the one-method rule: pick one method, use it under the same conditions every time, and compare only readings from that method. Never compare numbers across devices.
A tracking protocol that puts this into practice: use the same method every time, first thing in the morning, before eating, after using the bathroom. Use the same tape or the same scale. Take a weekly average instead of reacting to one day’s reading, and track your waist alongside your body fat percentage. Retest every 2 to 4 weeks and judge the trend across several months, not the change from one week to the next.
How to Find Your Number and Set a Target
Start with one measurement method, pick a target inside the healthy band for your age and sex, and retest every 2 to 4 weeks under the same conditions. Start by measuring your current body fat percentage with one method, then pick a target inside the healthy band for your age and sex. If you are above the healthy range, aim for the top of the band first, not the bottom. Small, reachable steps are easier to hold than a single dramatic goal.
- Body Fat Percentage Calculator: measure your body fat with the Navy tape method.
- Lean Body Mass Calculator: find your lean mass, so you know how much of your weight is muscle, bone, organs, and water.
- BMI Calculator: check your BMI result, but remember that BMI cannot tell fat from muscle.
- Ideal Weight Calculator: set a realistic weight goal.
- Macro Calculator: plan your macros for fat loss or muscle gain.
- Protein Intake Calculator: plan your protein intake, since enough protein helps you keep muscle while you lose fat.
Retest every two to four weeks, under the same conditions. Expect small ups and downs from hydration and measurement error. Look at the trend across several months, not the change from one week to the next. If your body fat percentage is falling, your waist is shrinking, and your strength is holding up, your plan is working.
How to Lower Your Body Fat Percentage
Lowering body fat comes down to three things: a moderate calorie deficit, enough protein, and resistance training. No single one works well alone, and crash dieting usually costs muscle along with fat.
Start with a moderate deficit of about 300 to 500 calories per day below your maintenance level (TDEE). A moderate deficit is easier to hold for months, and it protects muscle far better than an aggressive one. If your strength falls fast, your waist stalls, and fatigue rises, your deficit is probably too aggressive. Eat a little more and keep lifting.
Eat enough protein to protect muscle while you lose fat. For general fat loss, about 1.2 to 1.6 grams of protein per kilogram of body weight per day is a sound target. If you lift weights while cutting, aim higher, about 1.6 to 2.2 grams per kilogram per day, which is the range the International Society of Sports Nutrition position stand supports for preserving lean mass during energy restriction (ISSN guidance summary: https://weightfaq.com/weight-loss/protein-intake-for-weight-loss/).
Lift weights two or three times per week, covering the whole body. Resistance training is what tells your body to keep muscle while the deficit forces it to burn fat. Add daily walking and some cardio for general health, but do not rely on cardio alone. Cardio without lifting is how people lose weight and still end up with a high body fat percentage.
Expect slow progress, and judge it over months. A commonly used guideline is about 0.5 to 1.0 percent of body weight per week. As a rough illustration, an 80 kg person at 30 percent body fat carries 24 kg of fat and 56 kg of lean mass. Reaching 25 percent with lean mass fully preserved means losing about 5.3 kg of fat, which takes roughly 11 weeks at 0.5 kg per week. Real progress is usually slower, because some lean mass is normally lost too and adherence is never perfect. Treat that math as a planning aid, not a promise.
Reassess every 4 to 6 weeks under the same conditions. If your body fat percentage is falling, your waist is shrinking, and your strength is holding up, your plan is working. If the scale stalls but your waist shrinks and your strength rises, read the body recomposition section below before concluding that you have failed.
How Long Does It Take to Lower Body Fat Percentage?
Plan in months, not weeks. A commonly used guideline is about 0.5 to 1.0 percent of body weight per week. As a rough illustration, an 80 kg person at 30 percent body fat who keeps all lean mass would need to lose about 5.3 kg of fat to reach 25 percent, which takes roughly 11 weeks at 0.5 kg per week.
Real progress is usually slower, because some lean mass is normally lost too. A moderate deficit, enough protein, and resistance training are what keep the loss coming from fat rather than muscle.
Body Recomposition: Losing Fat While Gaining Muscle
Body recomposition means losing fat and gaining muscle at the same time, so the scale can stall while your body genuinely improves. Your waist shrinks, your strength rises, and your body fat percentage falls, all while your weight barely moves.
It works best for beginners, for people returning after a long break, and for people starting with a higher body fat percentage. It needs three things: resistance training, enough protein (see the action plan above), and a small deficit or maintenance calories rather than an aggressive cut.
Judge recomposition by the right signals, not the scale. Waist down, strength up, and body fat percentage down means the plan is working, even if your weight has not moved in a month. That is progress, not failure, and it is the most common reason people wrongly conclude that their plan has stopped working.
Frequently Asked Questions
What is a healthy body fat percentage?
For most adults: men 8-24%, women 21-35%, with the healthy band rising with age. Athletes sit lower; above 25% for men and 32% for women is generally classed as obese.
What is a healthy body fat percentage for women?
About 21-35% depending on age: 21-32% at 20-39, 23-33% at 40-59, 24-35% at 60-79.
What is a healthy body fat percentage for men?
About 8-24% depending on age: 8-19% at 20-39, 11-21% at 40-59, 13-24% at 60-79.
Is 20% body fat good?
For a man, 20% is in the acceptable band. For a woman, 20% is just below the healthy band and close to athlete level, fine for athletes but low as an everyday target.
Can body fat percentage be too low?
Yes. Below essential fat (2-5% men, 10-13% women), hormones, immunity, and bone repair suffer. Women may lose periods; men may see testosterone fall.
The bottom line is simple. A healthy body fat percentage is a range, not a single number. For most adults, that range is roughly 8 to 24 percent for men and 21 to 35 percent for women, rising with age. Stay inside the healthy band for your age and sex, watch your waistline as well as your total, keep enough fat to support your hormones and health, and measure the same way each time so you can trust the trend. Do that, and the number stops being a source of stress and becomes a useful guide.